Project 3 Sorting
Author Zhen Tong 120090694@link.cuhk.edu.cn
Projects Home: https://58191554.github.io/project_page.html
Quick Sort with MPI
In the quick sort with multi-process parallel code, the sort is being done in chunks, and the output of the sort function is
Bucket Sort with MPI
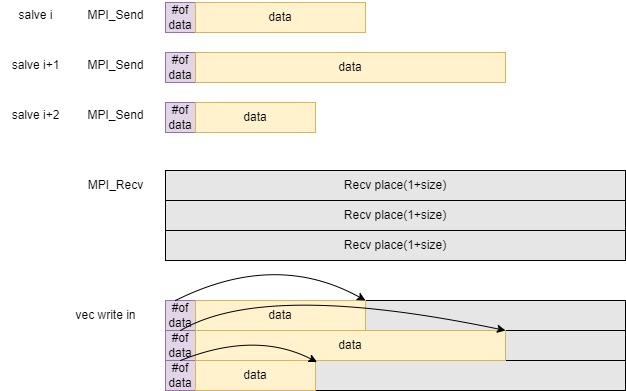
The idea of Bucket Sort is first divide the array into some bucket interval, sorted the bucket, and merge data with MPI_Send() function will send a structure of [#data, data], we need to tell how many data in one bucket, so that the master can move the data into the vector.

Indeed, the number of buckets in a bucket sort algorithm can significantly impact its performance. The choice of the number of buckets affects the balance between the size of each bucket and the number of comparisons and movements required during the sorting process.
Bucket Size:
Having too few buckets may lead to large bucket sizes, which could result in inefficient sorting within each bucket. If a bucket becomes too large, it might be better to use a more efficient sorting algorithm, such as insertion sort, within that bucket. In the experiment, for array size as
Numerical Analysis
Odd-Even Sort with MPI
The Odd-Even Sort is not a good algorithm in sequential, because it takes

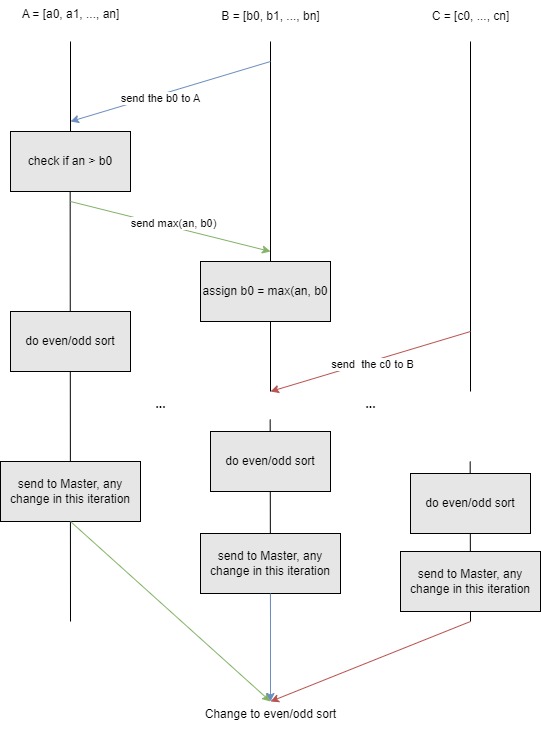
There is a trick in this question, we know that the MPI communication can be very expansive, and send the last signal sorted = ture/false can be too trivial to send. Therefore, we can first assume that the with
Merge Sort with OMP(Bonus)
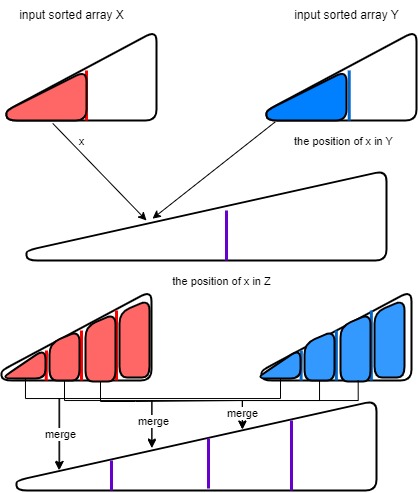
The merge sort is divide into two steps: the independent neighborhood sort, and recursive merge. The Sorting parallel is simple, we set the maximum number n number of thread to sort in n sub-arrays. The most difficult part is the merge parallelism. The way to merge independently and using parallelism first find the position of element

The binary search mentioned above is not really doing the binary search, but to return the rightmost element of the array.
xxxxxxxxxxint binarySearch(vi &vec, int val) {    int low = 0;    int high = vec.size();
    while (low < high) {        int mid = low + (high - low) / 2;
        if (vec[mid]<= val) {            low = mid+1;        } else {            high = mid;        }    }    return low; // Returns the rightmost position}
Although the performance degrade when thread number exceed 16, I try my best to control the thread distribution. The thread thread strategy is like this. Suppose there are
When there are
In each merging job, there are
Therefore, the
Performance
My Time Cost
| Workers | QuickSort(MPI) | BucketSort(MPI) | Odd-Even-Sort(MPI) | MergeSort(Threads) | QuickSort(Threads) |
|---|---|---|---|---|---|
| 1 | 14391 | 11500 | 37240 | 12070 | 12642 |
| 2 | 12690 | 7877 | 31547 | 6741 | 18162 |
| 4 | 9145 | 4476 | 19561 | 4837 | 18079 |
| 8 | 8177 | 2559 | 11544 | 4180 | 18069 |
| 16 | 7886 | 1691 | 6476 | 9176 | 18162 |
| 32 | 8397 | 1276 | 3598 | 17972 | 18298 |
Baseline
| Workers | QuickSort(MPI) | BucketSort(MPI) | Odd-Even-Sort(MPI) | MergeSort(Threads) | QuickSort(Threads) |
|---|---|---|---|---|---|
| 1 | 13708 | 11669 | 37077 | 25510 | 13006 |
| 2 | 12451 | 8901 | 29069 | 20431 | 10879 |
| 4 | 9093 | 5107 | 18603 | 10539 | 7804 |
| 8 | 7979 | 3457 | 11561 | 5537 | 4566 |
| 16 | 8014 | 2583 | 7418 | 3447 | 3808 |
| 32 | 8849 | 2469 | 5919 | 2063 | 3597 |
In the speed up, the odd-even algorithm parallel is the most linear-like case, this is because the MPI Communication is evenly distributed into the iteration, and we take a trick that the more slave we need to communicate, the less frequent our loop communicate to check stop.
The Quick Sort and the Bucket Sort's speedup is not as good as odd-even sort, because the merge of quick sort is sequential, and the heap size of the priority tree is getting bigger in merging state.
The Bucket Sort's efficiency is better the other 2 sort algorithm, because there is no increase of sequential part.
Profiling Results & Analysis with perf
Quick Sort
Cache Misses and References:
The number of cache misses decreases as the number of cores increases, indicating potential improvements in cache utilization.
Cache reference percentages show how often cache was successfully referenced. Some variability is observed, possibly due to the nature of the workload or cache behavior.
Cache Reference Percentage:
Generally, the cache reference percentage increases with the number of cores, suggesting better cache utilization as parallelism increases.
Bucket Sort
Cache Miss:
The number of cache misses first increase then decrease, because the increase is because data dependency was destroyed by dividing data into different process. However, the cache misses then decrease because, there are few data to deal with ,and there are also fewer cold cache miss.
Odd-Even Sort
Cache Misses and Cache References:
Cache References generally decreases.
The cache reference percentage is the percentage of cache references compared to the total number of cache accesses. It indicates the efficiency of cache utilization.
The percentage starts relatively low for 1 core and 2 cores, but significantly increases for 4 cores and beyond. This could be due to the parallel nature of the algorithm, where more cores result in a higher rate of cache references.
Number of Instructions:
The number of instructions executed increases with the number of cores, with the highest value at 16 cores. This increase in instructions may be attributed to the parallelization overhead and the execution of more instructions in parallel across multiple cores.
Recommendations:
Cache Optimization:
Analyze cache miss patterns to identify opportunities for optimization, such as improving cache locality or restructuring data.
Parallel Efficiency:
Evaluate parallel efficiency and scalability by comparing cache references and misses across different core counts.
Load Balancing:
Consider load balancing to ensure an even distribution of work among cores, reducing the potential for cache contention.
How to Run My Code
You can compile the code and run the code with one line.
xxxxxxxxxxchmod +x run.sh./run.shOr you can manually compile the code, and run the sbatch, the output will be in the log/Project3.txt, and log log/bonus.txt
xxxxxxxxxx# Compile the src code in buildmkdir build cd buildcmake ..make -j4
# Runcd ..sbatch src/sbach.shsbatch src/sbach_bonus.sh
Or you can run the tasks separately after compile. The output of perf will be in the log/task*.txt
x
# change permision to +x firstsbatch src/scripts/task1.sh sbatch src/scripts/task2.sh sbatch src/scripts/task3.sh Or you can execute the code with DIY parameter
xxxxxxxxxxperf_command="perf stat -e cycles,instructions,cache-references,cache-misses"xxxxxxxxxxsrun -n $num_cores --cpus-per-task 1 --mpi=pmi2 $perf_command ${CURRENT_DIR}/../build/src/quicksort/quicksort_mpi ${big_size}xxxxxxxxxxsrun -n $num_cores --cpus-per-task 1 --mpi=pmi2 $perf_command ${CURRENT_DIR}/../build/src/bucketsort/bucketsort_mpi ${big_size} ${big_bucket}xxxxxxxxxxsrun -n $num_cores --cpus-per-task 1 --mpi=pmi2 $perf_command ${CURRENT_DIR}/../build/src/odd-even-sort/odd-even-sort_mpi ${oddeven_size}
perf analysis
using my python code analysis.py it will extract the import data and do statistic for you, using useful regular expression
xxxxxxxxxxpython3 analysis.py Appendix
Table of data collected in the perf commend.
Quick Sort with MPI
| Cores | 1 | 2 | 4 | 8 | 16 | 32 |
|---|---|---|---|---|---|---|
| cache miss | 158025980.0 | 80729914.0 | 44110473.0 | 24038915.0 | 15048559.5 | 10519799.4 |
| cache reference | 230906748.0 | 118512881.0 | 64081817.5 | 33488426.8 | 19911586.6 | 14133144.1 |
| cache reference% | 68.437 | 66.221 | 65.43725 | 68.983625 | 74.95175 | 74.2 |
| instruction num | 542293108.0 | 670668560.0 | 593783905.0 | 602958409.5 | 437816684.6 | 667951908.6 |
Bucket Sort with MPI
| Cores | 1 | 2 | 4 | 8 | 16 | 32 |
|---|---|---|---|---|---|---|
| cache miss | 334679367.0 | 181321147.0 | 95741341.7 | 62101736.12 | 46433108.5 | 38768590.8 |
| cache reference | 477131827.0 | 259117596.0 | 141852335.7 | 84185615.5 | 56938498.0 | 43872005.5 |
| cache reference% | 70.144 | 69.769 | 66.81775 | 73.7505 | 82.3455625 | 89.3684375 |
| instruction num | 609065074.0 | 547796687.0 | 449616108.0 | 588080301.3 | 509110032.1 | 456636856.3 |
Odd-Even Sort with MPI
| Cores | 1 | 2 | 4 | 8 | 16 | 32 |
|---|---|---|---|---|---|---|
| cache miss | 189906.0 | 411674.0 | 2327726.5 | 3162682.5 | 3545464.625 | 3524768.625 |
| cache reference | 857956879.0 | 345477901.0 | 6620118.25 | 3424899.625 | 3998650.375 | 4695187.75 |
| cache reference% | 0.022 | 0.121 | 55.1 | 91.1 | 88.4 | 67.6 |
| instruction num | 222015385.0 | 554048876.5 | 485595380.25 | 477382203.2 | 629073048.3 | 473586805.375 |